
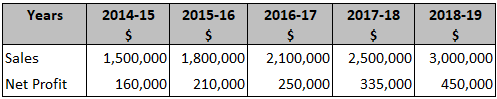
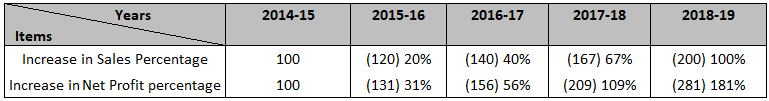
Trend analysis of financial statements helps information users to discern percentage changes over time in the selected data. For example, users can see whether a firm's net profit is increasing, decreasing, or stable, or whether there are fluctuations over the years. Horizontal analysis of financial statements can easily be expanded to include more than a single change from one year to the next. This is known as trend analysis. In many cases, it is important to examine changes over a specific period because this enables the evaluation of emerging trends that may influence performance in future years. The five-year summary of selected financial data, as found in all annual reports, is useful in this regard. When more than two years are included, index numbers are used instead of percentage changes. Essentially, one year is selected as the base year and is set to 100%. All other years are represented as a percentage of the base year. All in all, a person who is interested in assessing the earning capacity of an enterprise may compare sales and earnings for time horizons of 3, 5, and 7 years using the principles and techniques of trend analysis. The following formula is used to calculate an index number: Index number = (Index year dollar amount / Base year dollar amount) x 100 Identifying and analyzing trends enables financial statement users to make critical decisions. In trend analysis, percentage changes are calculated for several years instead of between two years. By examining the trend for a particular ratio, users can identify a problem or identify any signs of good management. Here, index numbers are constructed, keeping one year as the base year; the value of the item represented in that base year is equal to 100%. The value of the same item for other years is measured in relation to the value of the base year. The base year should be carefully selected because the year that is used to construct an index number should not be anomalous. Safeway's sales in 2015, the base year, were $15,102,673,000. Sales in 2019, the index year, were $19,642,201,000. The index for 2019 was 130.06, which was calculated as follows: Index number = ($19,642,201,000 / $15,102,673,000) x 100 = 130.06 This means that Safeway's sales in 2019 were 130.06% of 2015's sales (i.e., 1.30 times greater). The index numbers for the other items are calculated in the same manner. Index numbers are especially useful for measuring real growth. In this example, Safeway's sales increased 1.30 times between 2015 and 2019. However, it is unclear whether this reflects real growth in sales, the same unit sales at higher prices, or a combination of both. One way to find out is to compare the index number for sales growth to the rate of inflation for the same period. Inflation can be measured using an index such as the consumer price index for all urban consumers, or a specific price index for the industry. As a case in point, if the index is found to increase 1.20 times over the same period, we can assume that Safeway experienced real growth in sales between 2015 and 2019. The sales and net profit of Zenith Company for five years are shown below. In this example, we will undertake a trend analysis with 2014-15 as the base year. Calculation of Trend Percentage: Base Year 2014-15 The base year is 2014-15. Therefore, sales and net profit for 2015-16, 2016-17, 2017-18, and 2018-19 are divided by the base year sales and base year profit. In turn, the figure is multiplied by 100 to yield the trend percentage. For example, for 2015-16 (with 2014-15 as the base year), the following calculations are made: For Sales For Net Profit This process continues for each year, keeping 2014-15 as the base year. The performance trend in sales and net profit are growth-oriented, given the increasing trend. However, percentage growth in terms of net profit exceeded sales percentage growth. As such, in this example, the company is an attractive target for investment. Keeping 2014-15 as the base year, we can observe that the increase in the percentages of sales and net profit are as follows: Comparing the growth of sales and net profit together, it is clear that net profit growth is greater than sales growth. Specifically, over the five years, while there was an increase of 100% in terms of sales, the net profit increased by 181%. Vertical comparison of the yearly increase in sales and net profit indicates that: This comparative growth clearly reflects the efficiency and effectiveness of the company's management. Note: Only positive growth is shown in these examples, but growth may also be negative. Also, it is possible that there is consistency without positive or negative growth.What is Trend Analysis of Financial Statements?
Explanation
Formula to Calculate Index Number
Example 1
Interpretation
Example 2
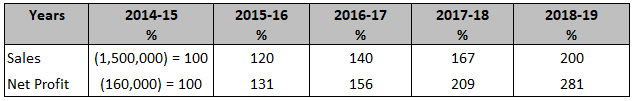
Calculation


Interpretation
Trend Analysis of Financial Statements FAQs
Trend analysis of financial statements helps information users to discern percentage changes over time in the selected data.
A trend analysis of financial statements can be used for various purposes, such as forecasting future demand, setting prices, or making investment decisions.
Some common methods for conducting a trend analysis of financial statements include regression analysis, moving averages, and exponential smoothing.
Advantages of using a trend analysis of financial statements include the ability to identify relationships and trends, make predictions, and set prices. Disadvantages of using a trend analysis of financial statements include the potential for inaccurate data points and the reliance on historical data.
There are several ways that you can prevent inaccuracies in your data when conducting a trend analysis of financial statements. One way is to use multiple methods of analysis to verify results. Additionally, it is important to be aware of the limitations of the data and use appropriate statistical techniques.
True Tamplin is a published author, public speaker, CEO of UpDigital, and founder of Finance Strategists.
True is a Certified Educator in Personal Finance (CEPF®), author of The Handy Financial Ratios Guide, a member of the Society for Advancing Business Editing and Writing, contributes to his financial education site, Finance Strategists, and has spoken to various financial communities such as the CFA Institute, as well as university students like his Alma mater, Biola University, where he received a bachelor of science in business and data analytics.
To learn more about True, visit his personal website or view his author profiles on Amazon, Nasdaq and Forbes.


