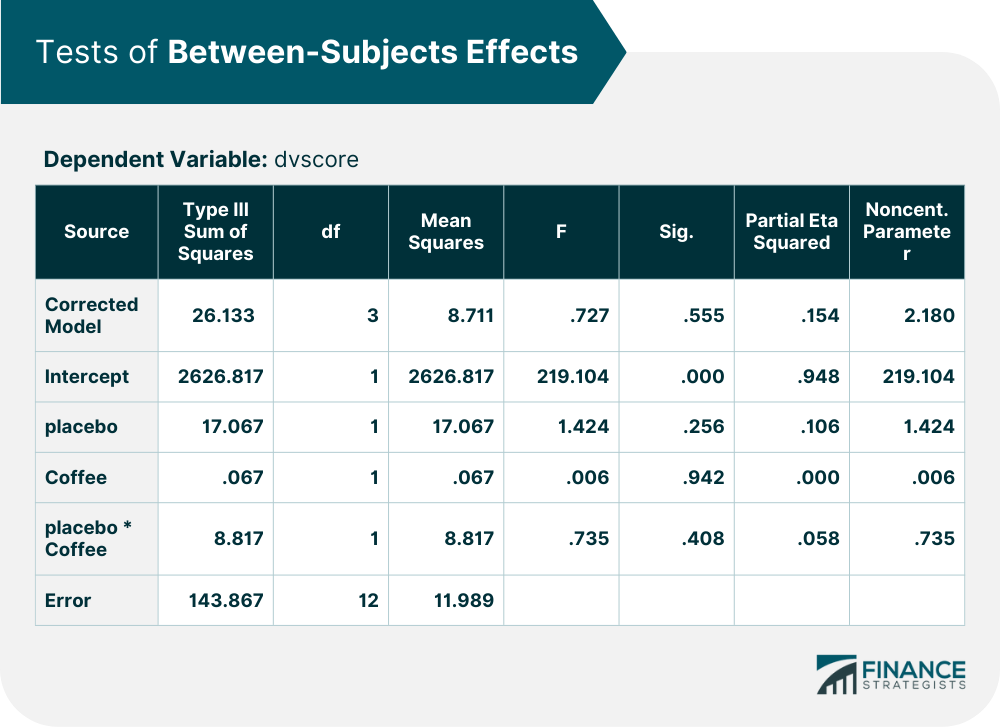
For the sake of this article, we will refer to this analytical method as "ANOVA." A quick definition of ANOVA is that it is a statistical analysis technique in which data sets are compared and measured to determine their significance. For a long definition, we'll walk through the process of the test and application of the results. This test effectively measures how significant the interaction is between variables; they analyze the variance. These tests start by creating a null hypothesis (Ho), which states that there is no significant difference between the variables being measured. If the test yields statistically significant results, then the tester can reject the null hypothesis, and accept the alternative hypothesis (H1), stating that the interaction between variables is significant. The F statistic is the ANOVA coefficient which tells us whether or not the results are significant. An F value around 1 denotes little to no difference in values; meaning there is not a significant variance between the groups. There are many statistical software systems that can run ANOVA tests for you, or some clever statistical calculations can be done to figure it out. The formula to find the F statistic is taking the mean squared error of the data set, and dividing it by the mean sum of squares of the data set. The formulas for finding the mean squared error and the mean sum of squares are a bit more complex and we won't be getting into that in this article. I recommend using a software system, as this can all be done in seconds. Now, what does all of this mean to you? Well, testing data is extremely important for both companies and investors. From a business standpoint, R&D workers may use ANOVA to analyze which method of development is most cost-efficient for the company. Similarly, investors may look at a company's sale records and run an ANOVA to determine whether or not the success of the company merits an investment. So now that we know the basics of what the test is, let's look at an example of what the raw data looks like and break down how to interpret the test results. Below is an example table of an ANOVA output. For this experiment, researchers wanted to discover if consumers would prefer cheap coffee over brand-name coffee through the placebo effect. The independent variables were brand of coffee and the presence of placebo, and the dependent variable was the consumer's rating of said coffee. If we remember from earlier, what we are looking at is how the variables interact with each other. That test result is shown in the "placebo * coffee" row. As you can see in the "F" column, the F statistic for that test is .735. What does that mean? That there is close to no variance between the groups of data. Also, looking at the next column over, the level of significance is over .05, meaning that the interaction is not significant. The researchers had to accept the null hypothesis stating no interaction would occur. So, let's look at these results through a financial lens. We can determine that the variance between data sets is not significant. When looking at different ways to develop a product, it is important to know if there is one way that is more cost effective than others. If the independent variables were "production track 1," and "production track 2," and the dependent variable was "production cost" insignificant results would entail that the variance between both production tracks is not enough to suggest one track or another. These results may dissuade investors, as they see that the company incapable of developing diverse directions to cost efficiency.Analysis of Variance (ANOVA) Definition
ANOVA Example
Pulling Conclusions from ANOVA
Analysis of Variance (ANOVA) FAQs
ANOVA stands for Analysis of Variance.
A quick definition of ANOVA is that it is a statistical analysis technique in which data sets are compared and measured to determine their significance.
From a business standpoint, R&D workers may use ANOVA to analyze which method of development is most cost-efficient for the company.
Investors may look at a company’s sale records and run an ANOVA to determine whether or not the success of the company merits an investment.
An F value around 1 or lower typically denotes little to no difference in values; meaning there is not a significant variance between the groups.
True Tamplin is a published author, public speaker, CEO of UpDigital, and founder of Finance Strategists.
True is a Certified Educator in Personal Finance (CEPF®), author of The Handy Financial Ratios Guide, a member of the Society for Advancing Business Editing and Writing, contributes to his financial education site, Finance Strategists, and has spoken to various financial communities such as the CFA Institute, as well as university students like his Alma mater, Biola University, where he received a bachelor of science in business and data analytics.
To learn more about True, visit his personal website or view his author profiles on Amazon, Nasdaq and Forbes.