Fiscal quarters, typically referred to as "Q" followed by a number (1-4), represent a three-month period in the fiscal calendar of corporations and other entities. This division of the fiscal year into four distinct periods aids in the reporting, analysis, and forecasting of a company's financial performance. By regularly dissecting the fiscal year into smaller chunks, businesses can better gauge their performance, implement timely strategies, and communicate transparently with stakeholders. There are four quarters in a year. A quarter refers to a three month period (i.e. one quarter of one year) on a company's financial calendar, that establishes a period for financial reports and dividend payments. Most financial reporting is done on a quarterly basis since this increment of time is a sweet spot, where data is less prone to the spikes and dips of smaller time frames, and investors receive timely updates on company performance. Financial quarters are typically expressed as "Q"followed by the quartile number; 1.) The first quarter is Q1 2.) The second quarter is Q2 3.) The third quarter is Q3 4.)The fourth quarter is Q4 Making the four quarters of the year. Quarters may also be represented along with their relevant year, as in Q1 2023 or Q1/23. Investors rely on quarterly earnings reports to determine financial trends which influence investment choices. Consequently, companies take quarterlies very seriously, since it has a big impact on investment/stock value. Publicly traded companies are required to file quarterly reports with the Securities Exchange Commission, or SEC. Quarterly reports are often audited to create confidence in the report, however an audit is not required. A "fiscal quarter"(or business quarters) is one-fourth of a fiscal year, which is a defined 12-month period for tax and accounting purposes. For most businesses, the fiscal year starts on January 1st and ends on December 31st; however, some businesses begin and end their fiscal year on different dates. The first quarter serves as a precursor, setting the tone for the rest of the fiscal year. Post-holiday season, companies delve deep into their revenue streams and sales performance. Analyzing these figures offers insights into consumer behavior and the effectiveness of year-end campaigns. For many sectors, particularly those that experience significant holiday sales, Q1 becomes a time of reflection and recalibration based on the preceding holiday rush. Beyond mere revenue, profit margins provide an in-depth understanding of a company's financial health. This measure highlights the percentage of revenue that exceeds the costs of goods sold. A detailed examination in Q1 allows companies to understand how effective they have been in controlling costs, optimizing pricing strategies, and navigating external economic factors. Strategies might be realigned during this period based on profit trends. Q1 often sees companies scrutinizing their expenses with a magnifying lens. This involves identifying any superfluous expenditures, ensuring that budgets are on track, and setting the groundwork for cost-saving measures in the subsequent quarters. Efficient expense management early in the year can pave the way for more significant profits and flexibility in later quarters. Companies may also take note of external events in Q1, such as global events, industry shifts, or geopolitical changes, which might have influenced their financial landscape. Recognizing these events ensures better preparation and forecasting for similar occurrences in the future. The second quarter brings forth the implications of early-year decisions. Here, companies observe key financial activities, identify patterns, and solidify trends that might dominate the fiscal year. The analysis might involve reviewing cash flow, understanding credit cycles, or scrutinizing investment returns. Capital expenditures (CapEx) often get special attention during Q2. Businesses might assess investments made in infrastructure, equipment, or technology. Ensuring that these investments yield desired results or recalibrating them for the upcoming quarters becomes vital. For product-based companies, Q2 demands a stringent review of inventory levels. Post-holiday clearance and spring season can influence stock levels significantly. Efficient inventory management ensures a balance between demand and supply, minimizing storage costs and ensuring timely product availability. Q2 often coincides with tax season. This period involves finalizing tax obligations, understanding fiscal liabilities, and optimizing strategies for tax savings. It's also a time when companies can reflect on the tax implications of their Q1 decisions and prepare better for the upcoming tax year. As companies cruise into the second half of the fiscal year, Q3 becomes a time for mid-year introspection. Organizations reflect on their performance thus far, comparing actual figures against projections, and evaluating areas of improvement. Q3 usually involves a meticulous financial review, comparing it with the previous quarters. This examination helps in understanding the trajectory, identifying any anomalies, and setting the stage for the year's final quarter. By Q3, companies have a clearer picture of where they stand concerning their annual goals. There might be a realignment of strategies, recalibration of targets, or even setting new objectives based on the current pace and industry trends. For many sectors, particularly retail, Q3 encompasses the back-to-school season, influencing sales and revenue. Seasonal trends, whether it involves summer-related products or services, also play a significant role in shaping the financial outlook for this quarter. The final quarter, Q4, involves a holistic assessment of the year's financial activities. Organizations gauge their overall performance, understanding the hits and misses, and deriving lessons for the forthcoming fiscal year. A recap of the year's revenue offers insights into the most lucrative months, the effectiveness of various campaigns, and customer behavior patterns. This data becomes foundational for strategy formulation in the subsequent year. A thorough summary of profits and losses aids in understanding the financial health of the company. It showcases areas where the company excelled and sectors that demand attention and improvement. Given the prominence of the holiday season in Q4, companies analyze its impact extensively. From retail giants to the travel industry, businesses across sectors gauge the influence of the holiday rush on their bottom line, setting the stage for improved strategies in the coming years. A comparative analysis across quarters provides a bird's eye view of a company's performance over the year. While individual quarterly analyses offer detailed insights, comparing them side by side reveals patterns and trends not immediately apparent when viewing the quarters in isolation. For instance, a company might recognize that Q2 consistently outperforms in sales due to seasonal demands or specific promotional events. Identifying these trends is crucial, as they provide a historical context, enabling companies to forecast future performances more accurately. Patterns also reveal themselves in areas like operational costs, marketing effectiveness, or even employee productivity. Over time, these patterns can guide strategy, helping businesses leverage upswings and prepare for or even counteract downturns. Almost every industry has its seasonality. Retailers might experience spikes during holiday seasons, while tourism companies could see rises during summer or specific holiday periods. A comparative quarter analysis assists in understanding these seasonal fluctuations better, allowing businesses to prepare in terms of inventory, staffing, marketing, and other essential operations. Understanding seasonal implications means companies can optimize their offerings and ensure they're adequately resourced during peak times. Conversely, during off-peak periods, companies might strategize differently, focusing on areas like training, maintenance, or cost-cutting. As businesses understand their quarterly performances in depth, they can make informed adjustments to their financial plans. These adjustments can range from reallocating budget from one department to another, scaling up marketing efforts, tweaking product or service prices, or even reconsidering investment strategies. This proactive approach, rooted in real data, ensures that businesses remain agile, optimizing their financial health while meeting their strategic objectives. One of the most significant challenges companies face is the natural variability in performance across quarters. This variability can be due to numerous factors: changing consumer behavior, global economic shifts, or unforeseen events. Companies must recognize that while patterns and trends provide guidance, they don't offer guarantees. Addressing these inconsistencies requires a mix of proactive planning, reactive strategy adjustments, and sometimes, a bit of resilience. Maintaining consistency in financial reporting is pivotal for any company. Stakeholders, be it investors, partners, or employees, rely on these reports to understand the company's health and performance. Inconsistent or misleading reporting can erode trust and even have legal implications. As each quarter might have its unique challenges and achievements, ensuring a consistent reporting framework that's both transparent and comparable can be a challenging endeavor. Each quarter might bring its unique market conditions. From shifts in global economies, technological disruptions, regulatory changes, or even socio-political events, companies have to adapt their strategies continuously. While businesses can predict some of these shifts, others might be entirely unexpected, requiring rapid strategic pivots. In today's digital age, data-driven decision-making isn't just a buzzword; it's a necessity. Companies should rely heavily on data analytics to understand their quarterly performance in depth. With the aid of modern analytics tools, businesses can derive insights that were previously hidden, leading to more informed decisions and better forecasting. Traditional financial planning, where strategies are set in stone at the start of the fiscal year, no longer suffices. Given the dynamic nature of today's markets, companies need to adopt agile financial planning. This approach involves regular reviews and adjustments to plans based on real-time data and market conditions. Quarterly reviews are pivotal in this approach, providing checkpoints to realign strategies. Companies should adopt a flexible approach to their operations, allowing them to adapt to unforeseen changes quickly. This flexibility isn't limited to financial strategy but extends to areas like operations, marketing, and even human resources. Furthermore, having robust contingency plans ensures that businesses can navigate unforeseen challenges more effectively. These plans, often developed based on historical data and predictive modeling, can be the difference between a minor setback and a significant disruption. If you would like more information about how your finances could be doing better with help from someone who understands what they are talking about, reach out to a financial advisor in Los Angeles County, CA or visit our financial advisor page if you live outside the area. Our team can create custom plans tailored just for you so that your money goes exactly where it needs to go. A fiscal quarter, denoted as "Q" followed by a number, represents a three-month segment in the financial calendar of organizations. This division of the fiscal year into four quarters offers an effective framework for reporting, analyzing, and forecasting financial performance. By dissecting the year into manageable periods, businesses can gain deeper insights, make timely strategic decisions, and maintain transparent communication with stakeholders. The four quarters - Q1 to Q4 - each hold specific significance. Q1 marks post-holiday reflections, profit assessment, and expense management. Q2 focuses on financial activities, inventory, and tax implications. Q3 involves mid-year assessment, goal evaluations, and seasonal trends. Q4 encompasses year-end analyses, revenue recap, and holiday impacts. Comparative analysis across quarters highlights trends and aids in adjusting financial plans. Challenges include managing performance variability, ensuring consistent reporting, and adapting to market shifts. Strategies involve data-driven analysis, agile planning, and fostering flexibility.What Is a Fiscal Quarter?
How Many Quarters in a Year?
What Does Quarterly Mean?
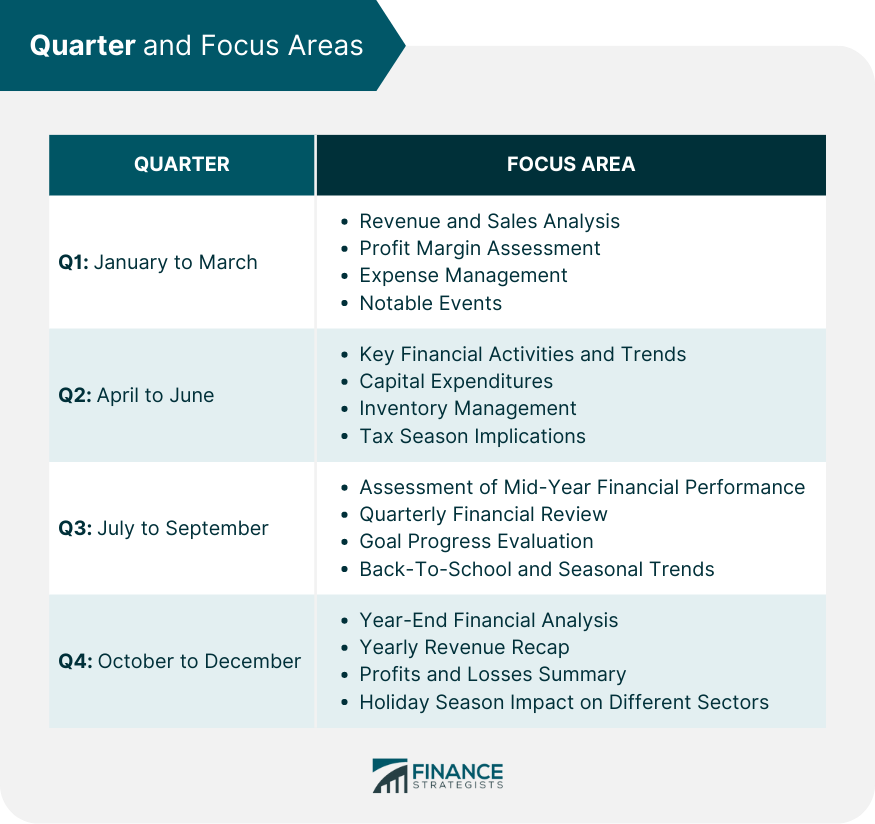
Q1: January to March
Revenue and Sales Analysis
Profit Margin Assessment
Expense Management
Notable Events
Q2: April to June
Key Financial Activities and Trends
Capital Expenditures
Inventory Management
Tax Season Implications
Q3: July to September
Assessment of Mid-Year Financial Performance
Quarterly Financial Review
Goal Progress Evaluation
Back-To-School and Seasonal Trends
Q4: October to December
Year-End Financial Analysis
Yearly Revenue Recap
Profits and Losses Summary
Holiday Season Impact on Different Sectors
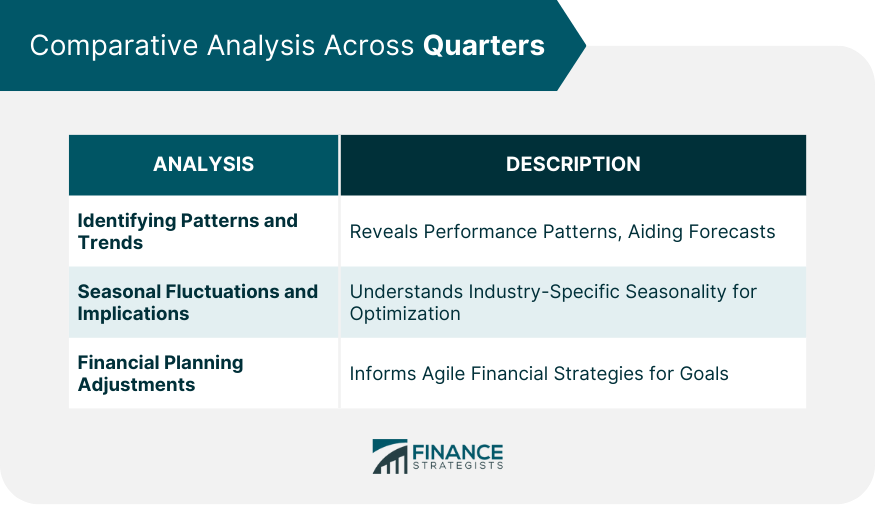
Comparative Analysis Across Quarters
Identifying Patterns and Trends
Seasonal Fluctuations and Their Implications
Adjustments in Financial Planning Based on Quarters
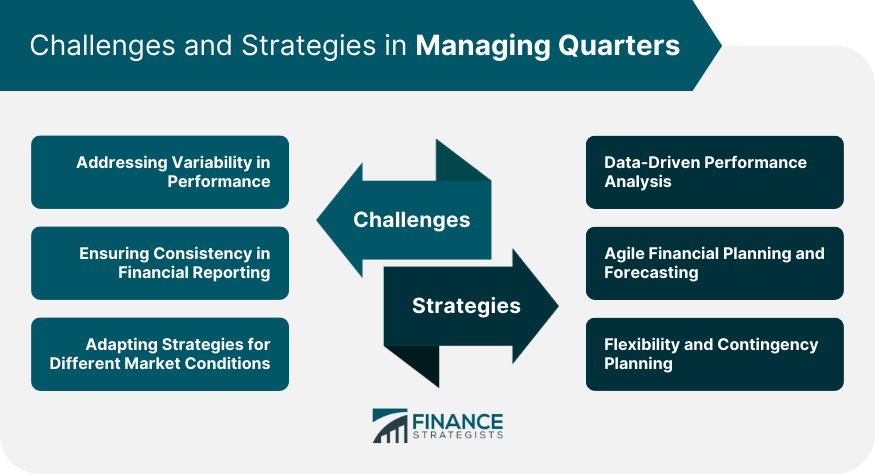
Challenges in Managing Quarters
Addressing Variability in Performance
Ensuring Consistency in Financial Reporting
Adapting Strategies for Different Market Conditions
Strategies in Managing Quarters
Data-Driven Performance Analysis
Agile Financial Planning and Forecasting
Flexibility and Contingency Planning
Get in Touch With Us!
Conclusion
Quarter (Q1, Q2, Q3, and Q4) FAQs
A quarter refers to a three month period (i.e. one quarter of one year) on a company’s financial calendar, that establishes a period for financial reports and dividend payments.
The first quarter is Q1, the second quarter is Q2, the third quarter is Q3, the third quarter is Q4.
Q1 is January, February, and March, Q2 is April, May, and June, Q3 is July, August, and September, and Q4 is October, November, and December.
There are four quarters in a year.
Publicly traded companies are required to file quarterly reports with the Securities Exchange Commission, or SEC.
True Tamplin is a published author, public speaker, CEO of UpDigital, and founder of Finance Strategists.
True is a Certified Educator in Personal Finance (CEPF®), author of The Handy Financial Ratios Guide, a member of the Society for Advancing Business Editing and Writing, contributes to his financial education site, Finance Strategists, and has spoken to various financial communities such as the CFA Institute, as well as university students like his Alma mater, Biola University, where he received a bachelor of science in business and data analytics.
To learn more about True, visit his personal website or view his author profiles on Amazon, Nasdaq and Forbes.