The Sharpe Ratio is a mathematical formula which measures the performance of an asset or a group of assets relative to their assumed risk. Formulaically, the Sharpe Ratio is the expected returns of an asset, minus the risk-free rate, divided by the standard deviation of excess returns, which is a measure of volatility. In other words, this formula helps an investor determine the performance of returns attributable to risk when compared to its riskiness. Sharpe Ratio is to allow investors to understand the return of an investment compared to its risk. Ideally, an investor seeks high returns with low risk, making the Sharpe Ratio a pivotal tool in assessing whether the returns of a given investment or portfolio are adequate, given the associated risks. The risk-free rate is a foundational concept in finance, representing the return on an investment that is deemed free from risk, such as a government bond. Typically, short-term U.S. Treasury Bills are taken as a benchmark for the risk-free rate, especially in the context of U.S. investments. It's the minimum return an investor expects for any investment because they could always place their funds in risk-free assets. This component reflects the total return of a portfolio or investment over a given period. It encompasses all sources of return, including dividends, interest, and capital gains. The portfolio return provides insight into how effectively the investment strategy has performed over the evaluation period. Standard deviation is a key measure of the volatility or risk associated with an investment or portfolio. A higher standard deviation indicates greater volatility, implying higher potential for fluctuations in returns. On the other hand, a lower standard deviation signifies more consistent returns. The Sharpe Ratio is calculated by subtracting the risk-free rate from the portfolio's return and dividing the resultant excess return by the portfolio’s standard deviation. The formula is as follows: By using this formula, investors can quantify the risk-adjusted returns of their investments, facilitating more informed decision-making. For example, Mr. Sharpe anticipates a 13% return on his portfolio in the coming year. He also knows the One-year US Treasury yield, which can be considered a risk-free investment, is 1.55%. He also calculates the volatility of his portfolio as 9%. Using these figures, he calculates a Sharpe ratio of 127%. Now Mr. Sharpe is considering a risky investment which is projected to raise his portfolio return to 22% and volatility to 29%. Using the same risk-free rate, the Sharpe Ratio will be 70%. Mr. Sharpe should not make the investment because his return relative to the risk assumed is nearly half of what it was. Stated another way, a higher Sharpe Ratio will indicate a greater return proportional to the risk taken on. A positive Sharpe Ratio suggests that the investment has historically provided a positive excess return for its level of risk. The higher the ratio, the better the investment's return performance relative to the amount of risk taken. Investments with a high Sharpe Ratio are often deemed favorable as they provide higher returns for a given level of risk, or equivalently, they offer the same level of returns for reduced risk. A zero Sharpe Ratio indicates that the portfolio or investment has historically provided a return equivalent to the risk-free rate. On the other hand, a negative ratio implies that the investment would have performed worse than the risk-free rate, making it an undesirable choice. Negative ratios can serve as warning signs to investors that they might be better off investing in risk-free assets rather than taking on the volatility of the examined investment. One of the primary uses of the Sharpe Ratio is in comparing the risk-adjusted performance of multiple portfolios or investments. By standardizing returns based on volatility, the Sharpe Ratio allows investors to easily evaluate various investments on a level playing field. For investors juggling multiple asset classes, the Sharpe Ratio can guide asset allocation decisions. By assessing the risk-adjusted returns of various asset classes, investors can determine which ones offer the best opportunities for their risk appetite. Fund managers and individual investors use the Sharpe Ratio to evaluate the performance of portfolios over time. It helps determine if the risks taken resulted in proportionate rewards, facilitating strategy adjustments if necessary. The Sharpe Ratio aids in understanding the risk profile of investments. By evaluating the volatility against returns, investors can make informed decisions about diversifying, hedging, or altering their investment mix. The Sharpe Ratio is one of the most widely used efficiency ratios in modern investing due to its simplicity and usefulness in comparing investment with differing characteristics. A drawback of using the Sharpe Ratio is that volatility, which is used in the denominator of the calculation does not necessarily equate to risk. Therefore, an investor should consider volatility as well as other qualitative factors indicative of an investment's risk in order to create a more accurate picture of an investment's risk-reward profile. One of the main criticisms of the Sharpe Ratio is that it assumes returns are normally distributed. In reality, financial returns can exhibit skewness and kurtosis, leading to deviations from this assumption and potentially misleading results. The Sharpe Ratio can be sensitive to fluctuations in the risk-free rate. A changing risk-free rate can significantly alter the ratio even if the portfolio's performance remains constant. While the Sharpe Ratio considers the total volatility, it doesn't distinguish between upside and downside volatility. Therefore, two portfolios with similar Sharpe Ratios could have very different risk profiles. The Sharpe Ratio doesn't account for non-linear relationships or risks inherent in some derivatives and structured products. Thus, its applicability can be limited in complex financial scenarios. The Sharpe Ratio quantifies an investment's risk-adjusted returns. It aids investors in comprehending the relationship between returns and risk, assisting them in making informed decisions. The ratio's components—risk-free rate, investment return, and standard deviation—combine to provide a comprehensive assessment of investment performance. Its application extends to portfolio comparison, asset allocation, performance evaluation, and risk management. A drawback lies in its assumption of a normal distribution of returns, potentially leading to inaccuracies. Additionally, its sensitivity to changes in the risk-free rate and inability to capture all risk types are limitations. Furthermore, the ratio's ignorance of non-linear relationships hampers its suitability for complex financial scenarios. Hence, while the Sharpe Ratio remains an essential tool, supplementing its insights with qualitative analysis is crucial for a holistic evaluation of investment risk and reward.Sharpe Ratio Definition
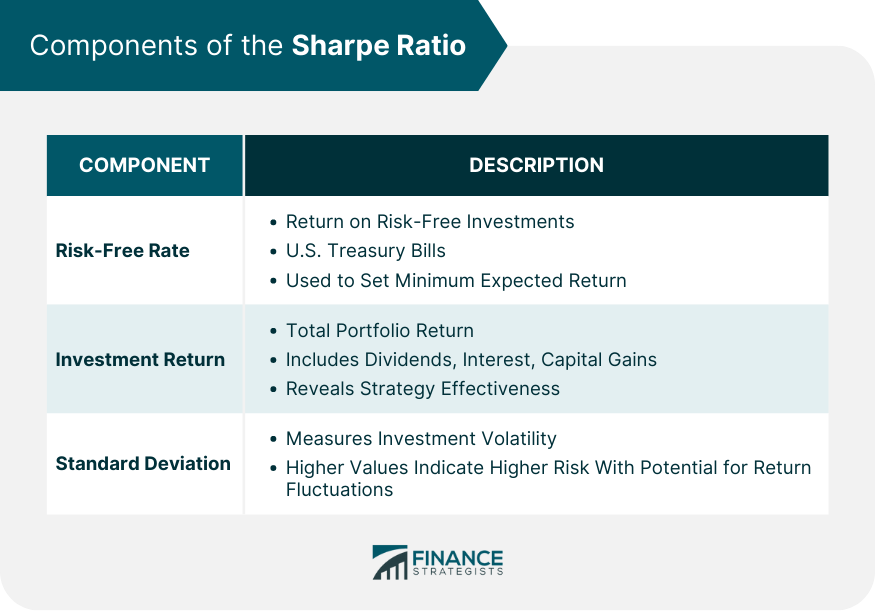
Components of the Sharpe Ratio
Risk-Free Rate
Investment Return
Standard Deviation
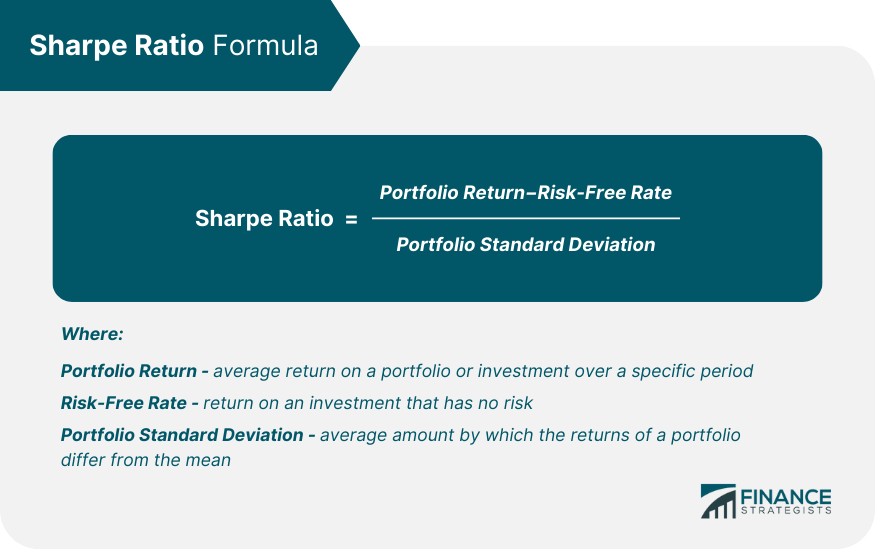
Calculation Formula of the Sharpe Ratio
Example of the Sharpe Ratio
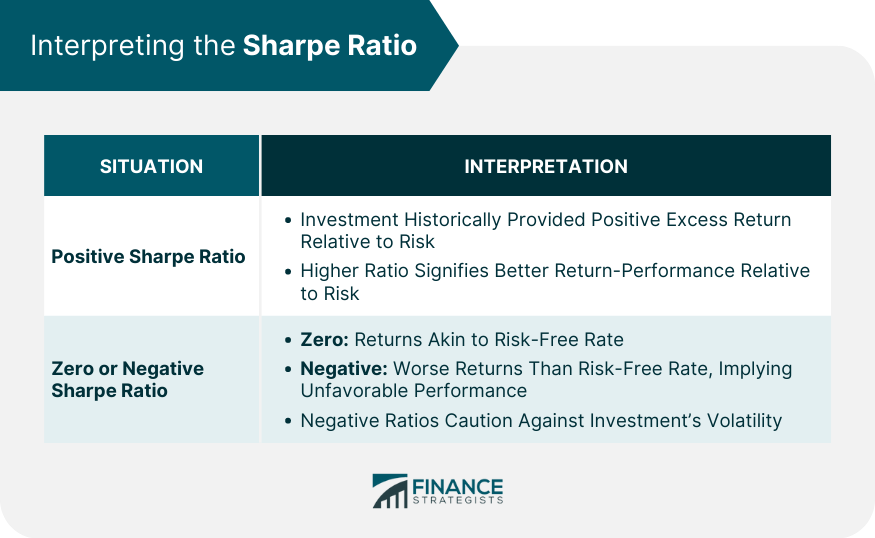
Interpreting the Sharpe Ratio
Positive Sharpe Ratio
Zero or Negative Sharpe Ratio
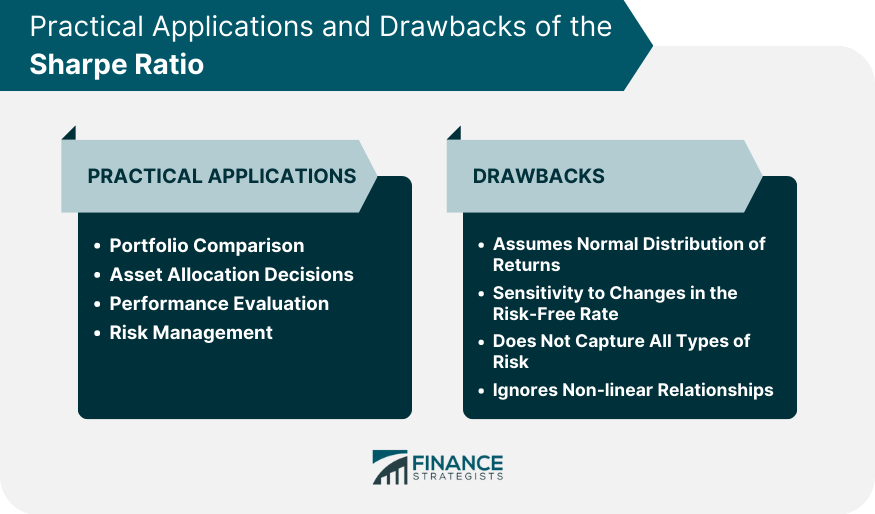
Practical Applications of Sharpe Ratio
Portfolio Comparison
Asset Allocation Decisions
Performance Evaluation
Risk Management
A Drawback of the Sharpe Ratio
Assumes Normal Distribution of Returns
Sensitivity to Changes in the Risk-Free Rate
Does Not Capture All Types of Risk
Ignores Non-linear Relationships
Conclusion
Sharpe Ratio FAQs
The Sharpe Ratio is a mathematical formula which measures the performance of an asset or a group of assets relative to their assumed risk.
The Sharpe Ratio is the expected returns of an asset, minus the risk-free rate, divided by the standard deviation of excess returns.
A drawback of using the Sharpe Ratio is that volatility, which is used in the denominator of the calculation, does not necessarily equate to risk.
The Sharpe Ratio is one of the most widely used efficiency ratios in modern investing due to its simplicity and usefulness in comparing investments with differing characteristics.
A higher Sharpe Ratio will indicate a greater return proportional to the risk taken on.
True Tamplin is a published author, public speaker, CEO of UpDigital, and founder of Finance Strategists.
True is a Certified Educator in Personal Finance (CEPF®), author of The Handy Financial Ratios Guide, a member of the Society for Advancing Business Editing and Writing, contributes to his financial education site, Finance Strategists, and has spoken to various financial communities such as the CFA Institute, as well as university students like his Alma mater, Biola University, where he received a bachelor of science in business and data analytics.
To learn more about True, visit his personal website or view his author profiles on Amazon, Nasdaq and Forbes.