Technical Analysis is built on the assumption that a security's price and volume history can serve as an indicator for future price movements. Technical Analysis assumes that trading behaviors of other investors occur in patterns and that history will repeat itself. It is a method used to evaluate securities and identify trading opportunities based on the study of past market data, primarily price and volume. Instead of focusing on a company's fundamentals, like earnings, financial statements, or industry outlook. Technical analysts rely on patterns and trends found in charts to predict future price movements. Generally, Fundamental Analysis is used to focus on a security's long-term profitability, whereas Technical Analysis is used for anticipating short-term patterns which can be leveraged for short-term profits. Technical Analysis has several limitations which investors must consider when using it. The first is that history does not always repeat itself in the same way exactly. Especially in efficient markets where information is symmetrical, investors will learn over time to preempt identifiable trends and behave differently, therefore changing the trend itself. Similarly, Technical Analysis can be a self-fulfilling prophecy. In our earlier example, if every investor uses Analysis Method A, then the security price will never reach 1.5% because the closer the security gets to 1.5%, the less investors will purchase it and push the price higher. One of the foundational pillars of technical analysis is that the market price of any asset, be it a stock, commodity, or currency, reflects all available information. This includes fundamental factors, such as earnings and economic indicators, broader macroeconomic factors, and even market psychology or trader emotions. Thus, technical analysts argue that all one really needs to analyze and predict future price movements is encapsulated in the price chart. Technical analysts believe that prices move in trends. Typically, these trends are classified as upward (bull markets), downward (bear markets), or sideways (ranging markets). Recognizing these trends early on is the key to profitable trading from a technician's perspective. Once a trend is established, it's more likely to continue than to reverse. This principle serves as the basis for many trading strategies, and the main task for many analysts is determining when a trend may be starting or ending. This principle primarily revolves around the consistent aspect of market psychology. Technical analysts posit that historical price movements tend to repeat themselves over time due to the collective and consistent emotional responses of market participants. As such, certain patterns that have been recurrent in the past can be used as benchmarks to predict future price movements. The recognition of these patterns, be they head and shoulders, double tops, or triangles, forms a significant component of technical trading strategies. One of the most common tools in the arsenal of a technical analyst is the moving average. It plots the average price of a security over a set number of days. There are various types of moving averages, such as the simple moving average (SMA) and the exponential moving average (EMA). When the price of a security crosses its moving average, or when two moving averages cross over each other, it can signal a potential trend reversal, providing trading opportunities. For instance, a common strategy involves buying a stock when its short-term moving average crosses above its long-term moving average. RSI is a momentum oscillator that measures the speed and change of price movements. It oscillates between zero and 100 and is typically used to identify overbought or oversold conditions in a traded security. If the RSI surpasses 70, it might mean that the asset is overbought and could be due for a price pullback. Conversely, if it drops below 30, the asset may be oversold, signaling a potential price increase. By comparing the levels of the RSI, traders can ascertain potential buy or sell opportunities. The MACD is a trend-following momentum indicator that shows the relationship between two moving averages of a security’s price. It consists of the MACD line, signal line, and the histogram. Trading signals are generated when the MACD line crosses the signal line. For instance, when the MACD line crosses above the signal line, it can be a bullish sign, suggesting a potential buy opportunity. Conversely, when the MACD line crosses below the signal line, it can be a bearish signal. Technical analysis offers the distinctive advantage of identifying recurring historical price patterns. By charting the movement of security prices, technicians can pinpoint patterns that tend to repeat over time. These patterns, such as double tops, flags, and triangles, have been recognized for decades and serve as reliable indicators for future price movements. This predictable repetition stems from market psychology and the collective behavior of market participants. Recognizing these patterns gives traders the confidence to make informed decisions, as they are basing their moves on tested and proven market behaviors. One of the key tenets of technical analysis is that 'the trend is your friend.' Identifying and understanding market trends are central to a technician's strategy. The ability to discern whether a market is in an uptrend, downtrend, or moving sideways allows traders to align their strategies accordingly. In an uptrend, buying or going long is the predominant strategy, while in a downtrend, short selling or hedging might be more appropriate. Not just confined to the broader market, trend identification can be applied to individual securities, sectors, or even commodities. Riding a trend, especially in its early stages, can result in significant profits. Conversely, recognizing the weakening of a trend can prevent potential losses. Through various tools like moving averages, trendlines, and momentum oscillators, technical analysts can efficiently gauge the strength, duration, and sustainability of a trend. Arguably one of the most practical advantages of technical analysis is its ability to provide clear entry and exit points. By studying resistance and support levels, technical analysts can determine optimal positions to enter or exit a trade. A break above a resistance level might signify a good entry point, as it indicates a strong upward momentum. Conversely, a dip below a support level can be a warning sign to exit a position or even to short sell. While technical analysis provides a structured approach to analyzing market data, it isn't devoid of subjectivity. Different analysts might interpret the same chart differently. For instance, while one analyst might see a forming head and shoulders pattern, another might interpret it as a consolidation phase before a breakout. This subjectivity can lead to varied trading signals and, consequently, different trading outcomes based on the same data set. Moreover, the vast array of technical indicators available means that traders can sometimes receive conflicting signals from different indicators on the same chart. While technical analysis excels in analyzing historical data and patterns, it often falls short during sudden news-driven events. Unexpected geopolitical incidents, surprise earnings reports, or unforeseen macroeconomic data releases can dramatically affect security prices. In such scenarios, historical data and patterns become less relevant as market sentiment is driven by the news event. Technical analysis, by design, focuses primarily on price and volume data. While this provides a deep dive into historical patterns and trends, it often overlooks the underlying fundamental factors driving a security or market. Ignoring company earnings, industry trends, macroeconomic indicators, or broader geopolitical scenarios can result in an incomplete picture. In certain situations, especially long-term investments, fundamentals can play a more significant role than past price patterns. Solely depending on technical analysis without considering the underlying fundamental health or potential of an asset can sometimes lead to misguided decisions. For example, Analysis Method A is developed on the premise that if a certain level of buy-volume occurs in the first three hours of market open, then investors should put a sell-limit at 1.5% higher than market open. It is because the price of this specific security is statistically likely to decrease once it reaches this threshold. This way, the trader will make money prior to the security's value decreasing. Technical Analysis is the practice of evaluating securities by analyzing their price and volume behavior and identifying price trends. This is contrasted with Fundamental Analysis in which investments are evaluated by the financial performance of a company as evidenced through fundamental ratios such as gross margin and ROI. Technical Analysis is a method of evaluating securities based on historical price and volume data to predict future price movements. It thrives on the belief that price patterns repeat and that market behavior follows identifiable trends. This technique offers several advantages, including the identification of historical price patterns, trend recognition, and clear entry and exit points. However, its subjectivity, limited effectiveness in news-driven events, and the oversight of fundamental factors serve as notable limitations. Technical Analysis is best suited for short-term trading strategies, complementing Fundamental Analysis that focuses on long-term profitability. While it provides valuable insights, it's essential to acknowledge its constraints and integrate it with other analytical approaches for well-rounded investment decisions. In the ever-evolving landscape of finance, striking a balance between technical and fundamental perspectives is key to successful trading.The Definition of Technical Analysis
The Purpose of Technical Analysis
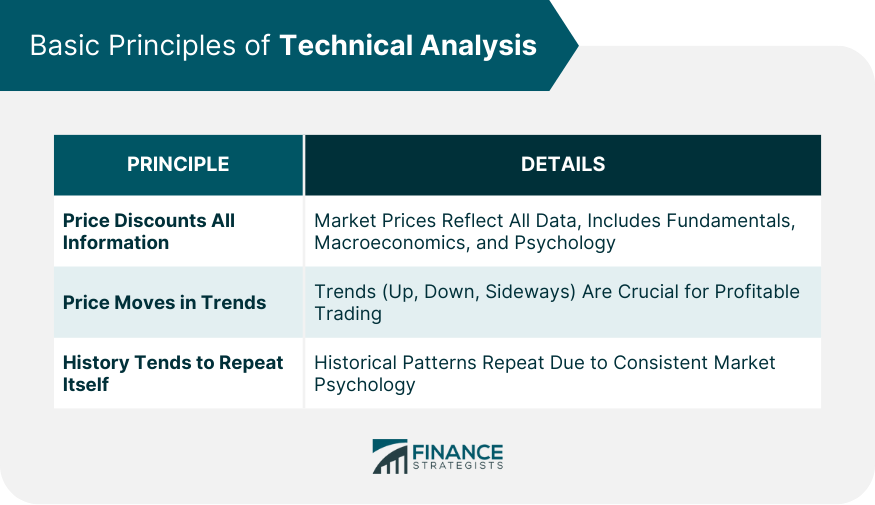
Basic Principles of Technical Analysis
Price Discounts All Information
Price Moves in Trends
History Tends to Repeat Itself
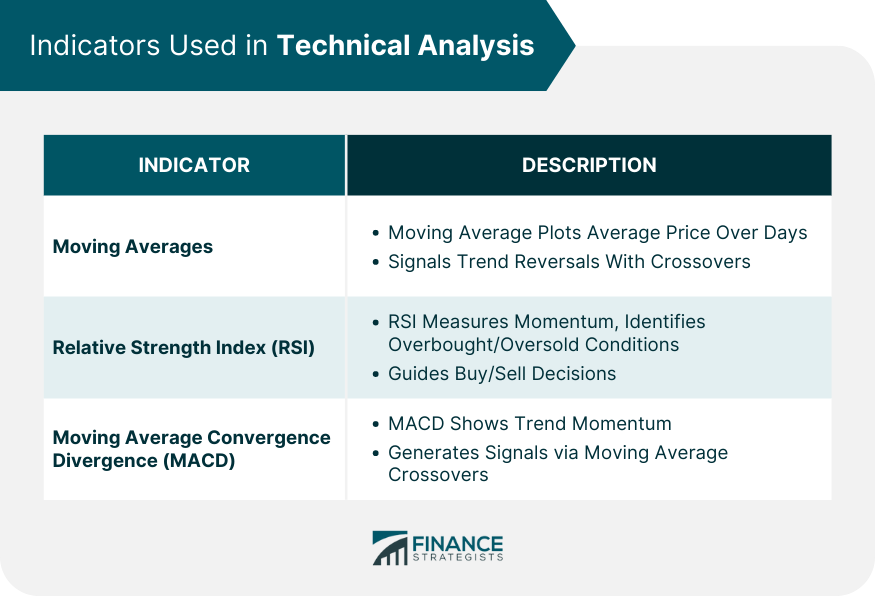
Indicators Used in Technical Analysis
Moving Averages
Relative Strength Index (RSI)
Moving Average Convergence Divergence (MACD)
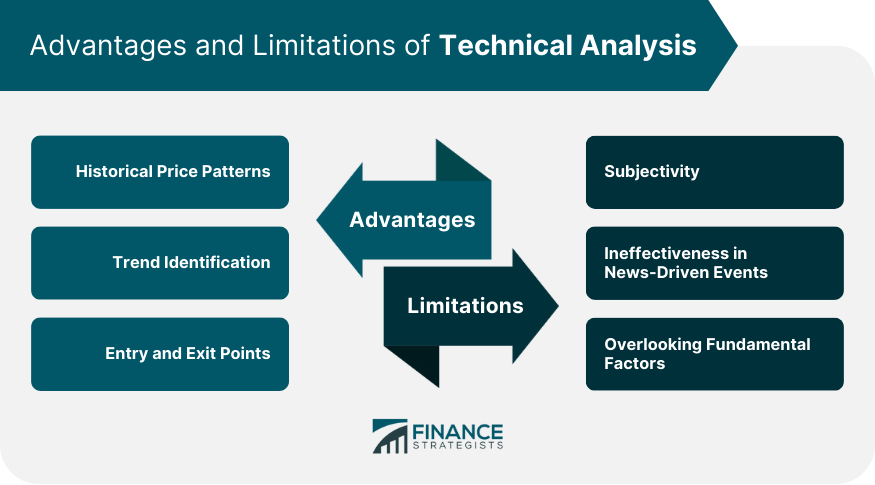
Advantages of Technical Analysis
Historical Price Patterns
Trend Identification
Entry and Exit Points
Limitations of Technical Analysis
Subjectivity
Ineffectiveness in News-Driven Events
Overlooking Fundamental Factors
Example of Technical Analysis
Technical Analysis vs Fundamental Analysis
Conclusion
Technical Analysis FAQs
Technical analysis is the practice of evaluating securities by analyzing their price and volume behavior and identifying price trends.
Technical analysis assumes that trading behaviors of other investors occur in patterns and that history will repeat itself.
Technical Analysis is used for anticipating short-term patterns which can be leveraged for short-term profits.
In efficient markets where information is symmetrical, investors will learn over time to preempt identifiable trends and behave differently, therefore changing the trend itself.
In fundamental analysis, investments are evaluated by the financial performance of a company as evidenced through fundamental ratios such as gross margin and ROI.
True Tamplin is a published author, public speaker, CEO of UpDigital, and founder of Finance Strategists.
True is a Certified Educator in Personal Finance (CEPF®), author of The Handy Financial Ratios Guide, a member of the Society for Advancing Business Editing and Writing, contributes to his financial education site, Finance Strategists, and has spoken to various financial communities such as the CFA Institute, as well as university students like his Alma mater, Biola University, where he received a bachelor of science in business and data analytics.
To learn more about True, visit his personal website or view his author profiles on Amazon, Nasdaq and Forbes.