Top-down stock analysis is an investment strategy that involves analyzing the macroeconomic environment before making investment decisions. Its main purpose is to identify market trends and make informed investment decisions. It identifies the best sectors and industries to invest in by analyzing the global economy, the stock market, and the key stock indices. A top-down analysis starts at the macro level, looking at the bigger picture, and then moves to the micro level, focusing on individual stocks or securities. This strategy differs from bottom-up analysis because it starts with a broader market view and works on individual stocks. Bottom-up analysis, on the other hand, starts with analyzing individual stocks and then looks at the broader market trends. While both approaches have their advantages, top-down analysis is often used in portfolio construction because it can help identify the best sectors and industries to invest in. Consider the following steps in performing top-down stock analysis: This step involves evaluating economic indicators, such as gross domestic product (GDP), inflation, and unemployment. Investors should also watch geopolitical events that could impact the global economy, such as trade tensions, political instability, or natural disasters. Analyzing the global economy is important because it can help investors identify the best sectors and industries to invest in. For example, during an economic expansion, consumer discretionary and technology sectors tend to perform well, while during a recession, defensive sectors such as healthcare and utilities tend to do better. This involves analyzing charts and technical indicators, such as moving averages, trend lines, and relative strength, to identify the direction of the stock market. Technical analysis is particularly useful in identifying trends and potential entry and exit points. For example, if the stock market is bullish, investors may look for opportunities to invest in stocks that are likely to benefit from this trend. The third step involves processing and scrutinizing economic data, such as consumer spending, retail sales, industrial production, price-to-earnings ratios, and dividend yields. Investors should also monitor market sentiment and news events that could impact the stock market. For example, if there is news of a major acquisition or merger, this could impact the performance of certain stocks. The final step in top-down stock analysis is to evaluate the key stock indices, like the S&P 500, the Dow Jones Industrial Average, and the Nasdaq Composite. These indices are used as a benchmark for the stock market's performance and can provide insights into the market's overall direction. Investors should analyze the performance of these indices to identify potential investment opportunities. For example, if the S&P 500 is in a bullish trend, this could indicate that the market is in a growth phase and that certain sectors, such as technology or consumer discretionary, may perform well. Top-down stock analysis is a useful approach for investors looking to identify market trends and make informed investment decisions. It allows investors to identify the best sectors and industries to invest in. By analyzing the global economy and the stock market's performance, investors can identify trends and potential investment opportunities. This approach can also help investors manage risk by avoiding underperforming sectors or industries. With such information, investors can build a well-positioned diversified portfolio to benefit from market trends. Additionally, top-down analysis can be used to spot potential entry and exit points. By analyzing charts and technical indicators, investors can identify support and resistance levels to help them make better-informed investment decisions. One potential drawback of top-down analysis is that it may overlook individual stocks that have strong fundamentals but are in a lackluster sector or industry. Since this approach focuses on broader market trends, investors may miss out on potentially profitable opportunities by solely focusing on the macroeconomic environment and not examining individual businesses or firms. Top-down analysis may not account for company-specific factors that can significantly impact stock performance beyond an industry, such as financial statements, competitive advantage, and overall management. Failing to consider these factors may result in missing out on potentially profitable opportunities or investing in companies with poor financial performance. To illustrate how top-down stock analysis works, consider the example of the COVID-19 pandemic. In 2020, the pandemic caused a global recession, and many sectors and industries were hit hard. However, some sectors, such as technology and healthcare, performed well as the pandemic accelerated the shift towards remote work and telemedicine. Using top-down analysis, an investor could have identified the trend towards remote work and invested in technology stocks such as Zoom Video Communications, Google Meet, or DocuSign. Similarly, by analyzing the growth in telemedicine, an investor could have bought healthcare stocks, such as Teladoc Health, Livongo, or One Medical. While top-down analysis focuses on the macroeconomic environment and works its way down to individual stocks, the bottom-up strategy starts with analyzing individual stocks and works its way up to broader market trends. As mentioned, top-down analysis helps investors identify market trends and potential opportunities based on the best sectors to invest in. However, it may overlook individual stocks that are performing well but are in an underachieving sector or industry. Bottom-up analysis can address this limitation with its focus on the fundamentals of individual companies. This approach can help investors identify undervalued or overlooked stocks with strong fundamentals and growth potential. Investors can make more informed investment decisions by combining both approaches. For example, an investor can start with a top-down analysis to identify the best sectors and then use bottom-up analysis to evaluate specific companies. Doing so can help investors build a diversified portfolio that is well-positioned to benefit from market trends while also accounting for individual company-specific factors. Top-down stock analysis is a useful investment strategy that involves analyzing the macroeconomic environment before making investment decisions. This approach offers several advantages, including identifying the best sectors and industries to invest in, managing risk, and identifying potential entry and exit points. However, top-down analysis has its limitations and potential drawbacks, such as overlooking individual stocks with strong fundamentals and not accounting for company-specific factors. Combining the top-down and bottom-up approaches can provide a more comprehensive analysis and help investors make more informed decisions. Investors can build a diversified portfolio that is well-positioned to benefit from macroeconomic trends while also accounting for individual company-specific factors. Investors should conduct thorough research and analysis before making investment decisions. They should consult a qualified financial advisor who specializes in wealth management services to ensure investments align with their financial goals and risk tolerance.What Is Top-Down Stock Analysis?
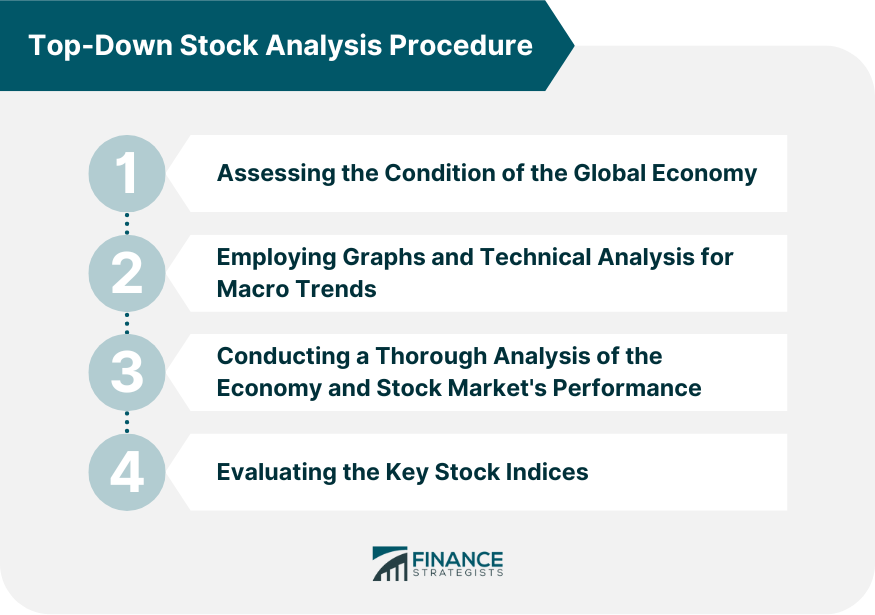
Top-Down Stock Analysis Procedure
Step 1: Assessing the Condition of the Global Economy
Step 2: Employing Graphs and Technical Analysis for Macro Trends
Step 3: Conducting a Thorough Analysis of the Economy and Stock Market's Performance
Step 4: Evaluating the Key Stock Indices
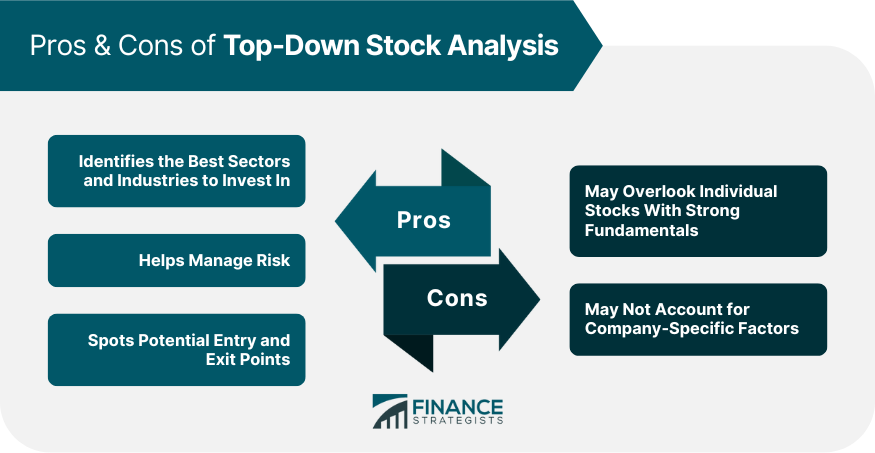
Pros of Top-Down Stock Analysis
Cons of Top-Down Stock Analysis
Example of Top-Down Stock Analysis
Top-Down Stock Analysis vs Bottom-Up Stock Analysis
Final Thoughts
Top-Down Stock Analysis FAQs
Top-down stock analysis starts with analyzing the macroeconomic environment and then looks at individual stocks. On the other hand, bottom-up analysis starts with analyzing individual stocks and then looks at broader market trends.
Top-down analysis is typically used for portfolio construction. For a more nuanced decision on individual stock selection, it is better to combine it with bottom-up analysis.
Some common tools and indicators used in top-down analysis include economic indicators, charts, technical analysis, and key stock indices.
Top-down analysis should be performed on a regular basis, say every two or more years, depending on market conditions and investment goals. Typically, it involves looking at longer periods compared to bottom-up analysis.
Potential drawbacks of top-down analysis include overlooking individual stocks that are performing well but are in a weak sector or industry. It may also fail to account for company-specific factors that impact stock performance.
True Tamplin is a published author, public speaker, CEO of UpDigital, and founder of Finance Strategists.
True is a Certified Educator in Personal Finance (CEPF®), author of The Handy Financial Ratios Guide, a member of the Society for Advancing Business Editing and Writing, contributes to his financial education site, Finance Strategists, and has spoken to various financial communities such as the CFA Institute, as well as university students like his Alma mater, Biola University, where he received a bachelor of science in business and data analytics.
To learn more about True, visit his personal website or view his author profiles on Amazon, Nasdaq and Forbes.