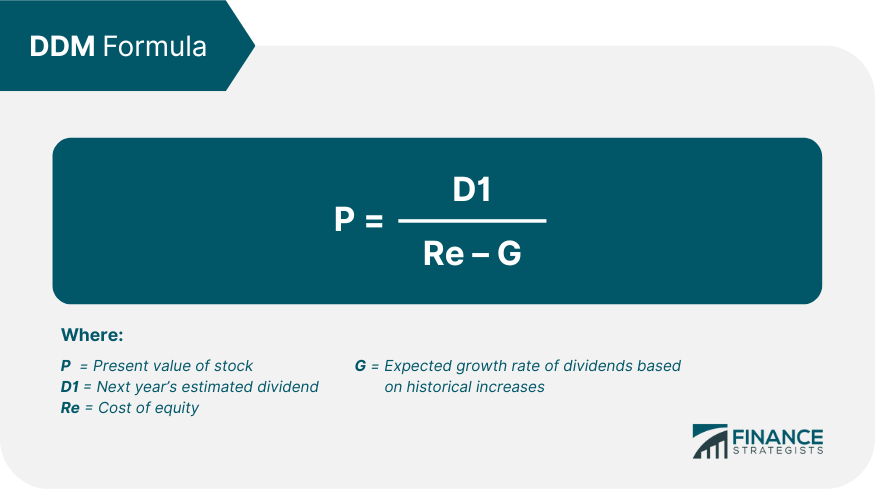
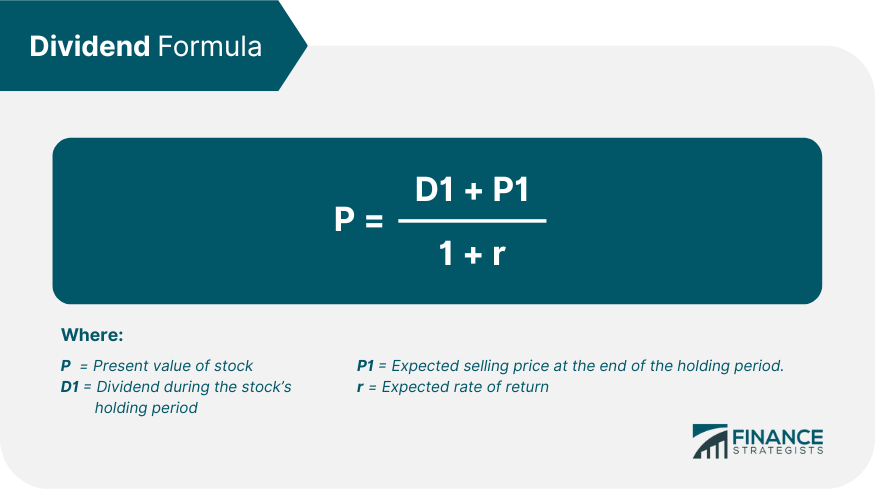
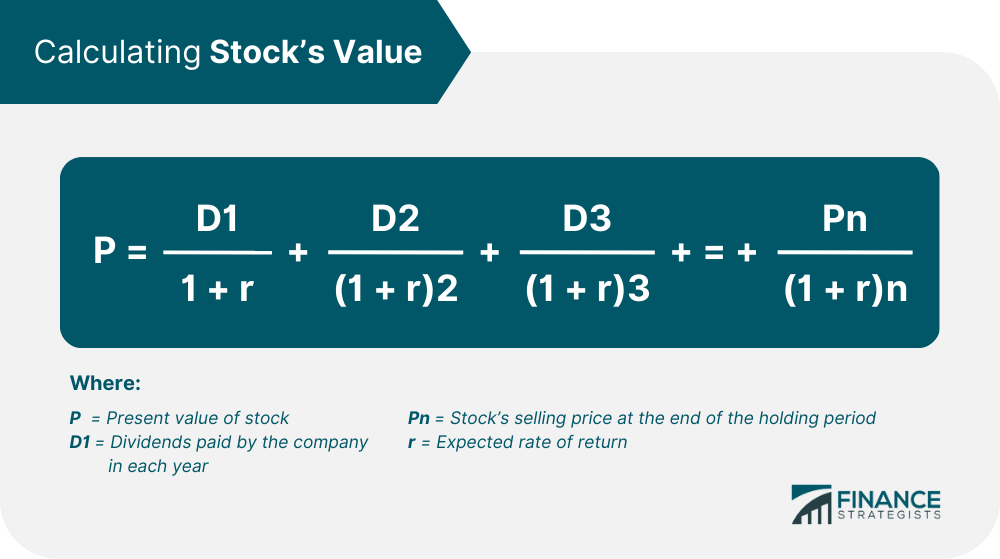
The dividend discount model, or DDM, is a valuation model to estimate a stock's price by discounting its future dividends to a present value. The model assumes that a company's future dividend payouts will continue to grow at a rate equal to the historical increases in its past dividends. DDMs are useful valuation tools for income investors. But they must be used with care because they do not take future changes in operating conditions or inputs to account in their calculations. To understand dividend discount models, you should be familiar with two concepts relating to it. The first one is the time value of money i.e., money in the future is worth less as compared to cash on hand today. Investors are more interested in a company's current earnings than its future potential. That is why future earnings must be discounted. The second concept is that of intrinsic value. Intrinsic value assigns an inherent value to a business by using its present earnings to calculate future cash flows. It assumes that the stock's current price contains all the information necessary to discount and extrapolate its future earnings and dividends. The rate of discount for these future cash flows is known as the Weighted Average Cost of Capital or WACC. It represents an "opportunity cost" or the cost to investors, if they had invested their money elsewhere during the same period. The formula to calculate DDM is: If next year's estimated dividend is $3, the cost of equity is 10%, and the expected perpetual growth rate of the dividends is 3%, then the present value of the stock, or "P" according to the dividend discount model is $42.86. The stock is undervalued, if P is higher than its current trading price. It is overvalued, if P is lower than the stock's current trading price. It is important to note that the value of P is the key to investment decisions. It does not matter if the firm is not making money or if its expected rate of dividend growth g is negative. If the present value P of a firm is less than the calculated DDM value, then it is possible for investors to profit from their investment. There are three variants of dividend discount models: This model assumes that a corporation exists forever and that its dividend growth will continue over a sustained period of time in the future. It is among the most popular dividend discount calculation methods and uses the same formula as the standard dividend discount model. This model estimates dividend discounts for short holding periods, typically for one year. The one-period dividend discount model is used by investors to estimate a fair price when they intend to sell the purchased stock at a target selling price. The formula to calculate dividends using this approach is: For example, suppose that you purchase a stock for $90 and intend to sell it at $100/share after a year at a cost of equity of 5%. The company will pay out a $5 dividend during this period. Then the stock's present value P = 100+5/1+0.5 = $70. Given that this figure is less than the stock's current price of $90, the stock is overvalued. This model calculates dividend payouts for a stock over multiple holding periods for investors who plan to purchase and sell the stock at different times during its growth trajectory and business cycles. The model is ideal for holding periods that are longer than a year. It is calculated each time an investor purchases the stock. Suppose that you purchase a company's stock for $10. It pays out a dividend of $3 that increases by 10% in the first year and 5% the next year. Investors in the company expect a rate of return of 5% and plan to hold the stock for three years at which time the price is estimated to be $15. Then the stock's value can be calculated as follows: Present value P = 3/ (1+0.05) +3.3 / (1.05)2+3.63/ (1.5)3 +15/ (1.5)3 = 16.72 Since this figure is more than the current price of the stock, it is undervalued. Like all models that attempt to predict future valuations for stocks, the dividend discount model also has major drawbacks. Specifically, there are two major drawbacks to this model. The first and most important one is that it does not take into account changes in company circumstances or operating environments and assumes that companies will pay dividends in perpetuity. This is an erroneous assumption because organizations work in dynamic business environments that are subject to multiple forces, such as regulation and competition. Their dividend payouts change with conditions in the economy that affect their business. The dividend discount model is also especially uncertain for new companies and startups that do not have a sufficient track record of payouts in the past. It works better with established companies, such as utilities or established behemoths like GE and IBM, which have been around for several years and have a history of making regular dividend payments. Even here, it is important to remember that the key assumption of dividends in perpetuity is subject to the firm's earnings. If dividend growth outpaces earnings, then the company will have a negative rate of return. The second drawback of dividend discount models is that the formula is sensitive to inputs. If the expected rate of dividend growth changes, then the end result can be completely different. For example, if the expected rate of dividend growth increases from 3% to 5% in our previous example, then the estimated share price would be $60 instead of $42.86. What Is the Dividend Discount Model?
Understanding Dividend Discount Models
Variants of Dividend Discount Models
Gordon-Growth Model
One-Period Dividend Discount Model
The Multi-Period Dividend Discount Model
Dividend Discount Model Drawbacks
Dividend Discount Model (DDM) FAQs
DDM stands for the Dividend Discount Model.
The dividend discount model, or DDM, is a valuation model to estimate a stock’s price by discounting its future dividends to a present value
Because investors expect to earn interest on their money over time, money today is worth more than the same value paid out at a later date. This is why future payouts are “discounted” when computing their value today.
The Dividend Discount Model factors in an estimated perpetual increase of the dividend payout made over time based on historical increases of the dividend payout.
True Tamplin is a published author, public speaker, CEO of UpDigital, and founder of Finance Strategists.
True is a Certified Educator in Personal Finance (CEPF®), author of The Handy Financial Ratios Guide, a member of the Society for Advancing Business Editing and Writing, contributes to his financial education site, Finance Strategists, and has spoken to various financial communities such as the CFA Institute, as well as university students like his Alma mater, Biola University, where he received a bachelor of science in business and data analytics.
To learn more about True, visit his personal website or view his author profiles on Amazon, Nasdaq and Forbes.